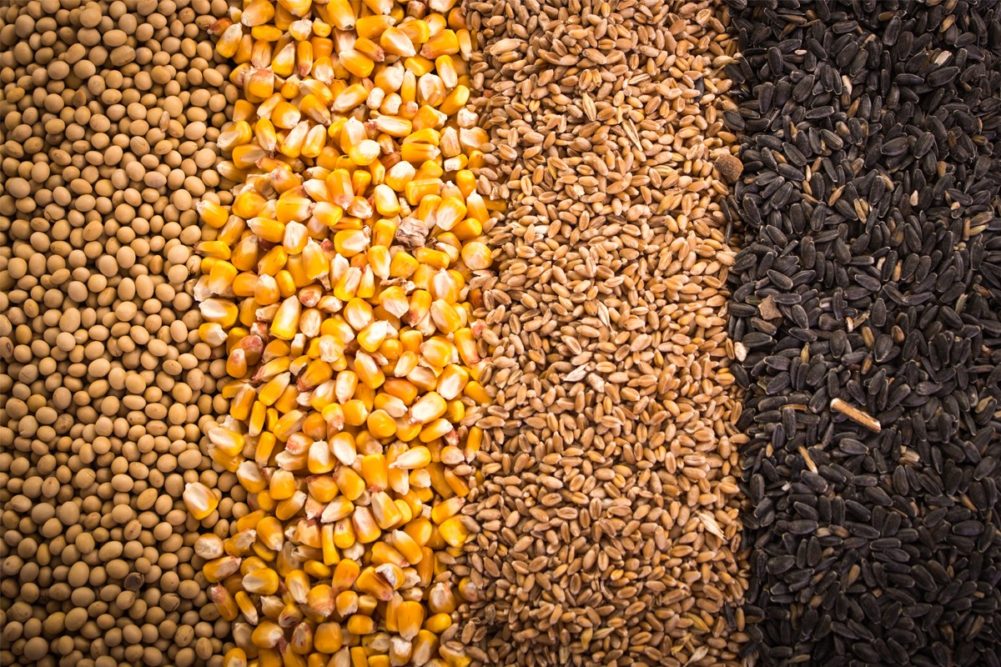
KANSAS CITY, MO. — A bevy of reports from the US Department of Agriculture on Jan. 12 were viewed as mostly bearish on corn futures but supportive for soybeans, relative to trade expectations.
Chicago Board of Trade wheat futures closed lower after the reports, corn futures were narrowly mixed and soybean futures ended higher, aided by the USDA’s lowering of global ending stock forecasts amid persisting reports of dry weather impacting crops in South America.
World agricultural supply and demand estimates
Corn carryover on Sept. 1, 2022, was forecast at 1,540 million bus, up 47 million bus, or 3.1%, from December and up 25% from 1,235 million bus a year earlier.
Soybean carryover on Sept. 1, 2022, was forecast at 350 million bus, up 10 million bus, or 2.9%, from December and up 36% from 257 million bus in 2021.
The averages of trade expectations for the USDA’s carryover projections were 1,472 million bus for corn and 348 million bus for soybeans.
Crop production, 2021 summary
Corn production in 2021 was estimated at 15,115,170,000 bus, up 53 million bus from the most recent estimate in November and up 7% from 2020. The average yield set a record high at 177 bus per acre, unchanged from November but up 5.6 bus from 2020. Harvested area was estimated at 85,388,000 acres, up 303,000 acres from November and up 3,075,000 acres, or 3.7%, from 2020. The average of trade expectations for corn production was 15,069 million bus, with the USDA estimate squarely within the full range of individual trade expectations.
Soybean production was estimated at 4,435,232,000 bus, up 10,290,000 bus, or 2.3%, from November and up 218,930,000 bus, or 5%, from 2020. Average yield was estimated at 51.4 bus per acre, up 0.2 bu from the prior estimate and up 0.4 bu from 2020. The yield was the second highest recorded after 2016’s record setting 51.9 bus per acre. Harvested area was estimated at 86,332,000 acres, down 104,000 acres from the previous estimate but up 3,729,000 acres, or 4.5%, from 2020. The average of trade expectations for soybean production was 4,433 million bus.
Corn stocks on Dec. 1, 2021, were estimated at 11,647,102,000 bus, up 3.1% from a year ago, including on-farm stocks at 7,234,000,000 bus, up 3%, and off-farm stocks at 4,413,102,000 bus, up 4%. Indicated September-November corn disappearance was 4.70 billion bus, down from 4.74 billion bus a year earlier.
Soybean stocks on Dec. 1, 2021, were estimated at 3,149,283,000 bus, up 7% from Dec. 1, 2020, including 1,522,000,000 bus on farms, up 16%, and 1,627,283,000 bus off farms, down 1%. Indicated September-November disappearance was 1.54 billion bus, down 14% from the same period a year earlier.